Photo: ©iStock.com/peterkai
Since the late 1930s, the U.S. Department of Agriculture’s Forest Service (USFS) Termiticide Testing Program has investigated various soil-applied termiticides for efficacy against subterranean termites. These studies were originally funded by the U.S. military in anticipation of action in the Pacific Theater during World War II. Termiticide testing was necessary to protect their military installations and shipping containers, which were constructed from wood and at high risk of structural failure from destructive termites, like the Formosan subterranean termite (Coptotermes formosanus). Now funded by the pest management industry, the Termiticide Testing Program continues to examine long-term efficacy of termiticides, the results of which are formally summarized annually in this termiticide report.
In its current capacity, the testing program works with cooperators from chemical manufacturers who are seeking federal registration of new termiticides. The U.S. Environmental Protection Agency (EPA) provides guidance for the efficacy testing requirements for federal registration in two documents: OPPTS 810.3600 and the Pesticide Registration Notice 96-7. The methods required by the EPA are the same as those developed by the USFS during our years of efficacy testing.
Locations for these studies have varied over the years, but at present there are four nationwide testing sites in the continental United States:
- Santa Rita Experimental Range in southern Arizona,
- Chipola Experimental Forest in northwestern Florida,
- Harrison Experimental Forest in southern Mississippi,
- Calhoun Experimental Forest in western South Carolina.
All sites are inhabited by species of Reticulitermes; the Arizona site also contains Heterotermes spp.
| Table 1. Number of years that repellent termiticides remained effective in concrete-slab (CS) and ground-board (GB) tests on four field sites applying the EPA guideline and Florida Efficacy Rule.† Fractions of years occurred when products were installed out of cycle. Control = percentage of all untreated plots attacked over the life of the study. | ||||||||||
| Arizona | Florida | Mississippi | South Carolina | FL | ||||||
| % A.I. | Test | EPA | FL | EPA | FL | EPA | FL | EPA | FL | SE States |
| Bifenthrin – Biflex TC (study established 1986 and closed 2011) | ||||||||||
| 0.031 | CS | 0 | 9 | 4 | 11 | 2 | 5 | 2 | 4 | 4 |
| 0.062†† | CS | 16 | 16 | 22 | 22 | 7 | 7 | 10 | 16 | 10 |
| 0.125†† | CS | 10 | 15 | 9 | 25 | 2 | 7 | 24 | 25 | 9 |
| 0.25 | CS | 25 | 25 | 25 | 25 | 16 | 17 | 25 | 25 | 25 |
| 0.5 | CS | 6 | 23 | 25 | 25 | 18 | 24 | 25 | 25 | 25 |
| 0.031 | GB | 6 | 7 | 4 | 5 | 2 | 2 | 3 | 4 | 4 |
| 0.5 | GB | 10 | 11 | 14 | 21 | 12 | 15 | 8 | 11 | 14 |
| Control | CS | 52% | 68% | 51% | 59% | – | ||||
| Control | GB | 68% | 86% | 74% | 84% | – | ||||
| Cypermethrin (study established 1982 and closed 2004) | ||||||||||
| 0.125 | CS | 1 | 4 | 0.5 | 1.5 | 1 | 3 | 2 | 2 | 2 |
| 0.25†† | CS | 4 | 4 | 10.5 | 12.5 | 3 | 5 | 4 | 4 | 4 |
| 0.5†† | CS | 4 | 5 | 4.5 | 9.5 | 7 | 14 | 12 | 12 | 11.5 |
| 1 | CS | 8 | 10 | 7.5 | 21.5 | 6 | 15 | 12 | 16 | 15 |
| 1 | GB | 3 | 6 | 4.5 | 4.5 | 5 | 5 | 5 | 6 | 5 |
| Control | CS | 62% | 66% | 50% | 60% | – | ||||
| Control | GB | 73% | 75% | 85% | 88% | – | ||||
| Permethrin – Dragnet (study established 1978 and closed 2004) | ||||||||||
| 0.25 | CS | 8 | 10 | 2 | 2 | 1 | 2 | 0.5 | 0.5 | 1 |
| 0.5†† | CS | 13 | 19 | 4 | 4 | 5 | 6 | 4.5 | 4.5 | 4.5 |
| 1.0†† | CS | 15 | 15 | 15 | 25 | 5 | 8 | 10.5 | 11.5 | 10.5 |
| 1.0†† | GB | 9 | 11 | 6 | 6 | 2 | 3 | 0.5 | 3.5 | 3 |
| Control | CS | 50% | 55% | 60% | 53% | – | ||||
| Control | GB | 43% | 78% | 86% | 84% | – | ||||
| Permethrin – Torpedo (study established 1980 and closed 2011). Controls same as cypermethrin | ||||||||||
| 0.25 | CS | 9 | 9 | 3 | 7 | 2 | 2 | 0.5 | 0.5 | 1.5 |
| 0.5†† | CS | 11 | 13 | 6 | 9 | 3 | 5 | 1.5 | 4.5 | 5 |
| 1.0†† | CS | 19 | 31 | 25 | 27 | 3 | 7 | 6.5 | 7.5 | 7 |
| 0.5†† | GB | 4 | 4 | 4 | 4 | 1 | 1 | 1.5 | 1.5 | 1.5 |
| 1.0†† | GB | 8 | 9 | 5 | 5 | 2 | 2 | 1.5 | 1.5 | 1.5 |
| † EPA: years with no penetration through treated soil in any plot. | ||||||||||
| FL: years with no annual damage more severe than ASTM 9 to blocks or boards on 90% or more of the plots per site (each annual evaluation stands alone, not cumulative). | ||||||||||
| FL SE States: years with no annual damage more severe than ASTM 9 to blocks or boards on 90% or more of the plots across the southeastern sites (damage ratings are annual, not cumulative). | ||||||||||
| †† Registered label rates. | ||||||||||
Fig. 1 illustrates the number of candidate soil-applied termiticides and number of sites installed each year since 1995. From this graph, it is apparent that the number of products installed each year cycles over the years — with a peak in 2004-2005, and a low point in 2011. More importantly, the graph shows that there has been a dramatic reduction in the number of candidate products over the past decade compared with the previous decade.
Because candidate products are those that could possibly pass registration and reach the commercial market, the number of products that will successfully pass the efficacy standards of EPA or state regulatory agencies is predicted to be even lower. As a result, there is a limited stream of new products entering the soil-applied termiticide market. In our previous reports, we stated that the current low numbers of candidate termiticides entering the testing program inevitably results in fewer new products reaching the market. This reduces (or holds steady) the choices available to the pest management industry and their customers.
In 2015, the USFS Termiticide Testing Program installed one new product at a single site. That product will be installed at the remaining sites in 2016. Including the one installed in 2015, there are three candidate termiticides undergoing testing at this time. It’s important to point out that our policy is to keep products confidential until they receive federal registration, which is why you do not see these three products listed on this year’s charts.
| Table 2. Number of years that non-repellent termiticides remained effective in concrete-slab (CS) and ground-board (GB) tests on four field sites applying the EPA guideline and Florida Efficacy Rule.† Fractions of years occurred when products were installed out of cycle. Control = percentage of all untreated plots attacked over the life of the study. | ||||||||||
| Arizona | Florida | Mississippi | South Carolina | FL | ||||||
| % A.I. | Test | EPA | FL | EPA | FL | EPA | FL | EPA | FL | SE States |
| Imidacloprid – Premise 75 WSP (study established 1992 and closed 2007) | ||||||||||
| 0.025 | CS | 15 | 15 | 15 | 15 | 1 | 1 | 3 | 4 | 2 |
| 0.05†† | CS | 15 | 15 | 6 | 12 | 2 | 2 | 10 | 10 | 6 |
| 0.1†† | CS | 15 | 15 | 15 | 15 | 2 | 4 | 5 | 15 | 8 |
| 0.15 | CS | 15 | 15 | 15 | 15 | 3 | 4 | 5 | 15 | 5 |
| 0.2 | CS | 15 | 15 | 15 | 15 | 2 | 5 | 5 | 5 | 5 |
| 0.25 | CS | 15 | 15 | 12 | 15 | 2 | 2 | 8 | 9 | 8 |
| 0.3 | CS | 15 | 15 | 15 | 15 | 5 | 5 | 5 | 11 | 14 |
| 0.4 | CS | 15 | 15 | 12 | 15 | 5 | 9 | 5 | 14 | 15 |
| 0.1†† | GB | 3 | 7 | 2 | 2 | 1 | 1 | 2 | 2 | 2 |
| 0.2 | GB | 8 | 14 | 2 | 2 | 2 | 2 | 2 | 2 | 2 |
| 0.3 | GB | 5 | 6 | 2 | 2 | 2 | 2 | 1 | 2 | 2 |
| 0.4 | GB | 5 | 7 | 2 | 3 | 2 | 2 | 4 | 5 | 2 |
| Control | CS | 33% | 77% | 75% | 36% | – | ||||
| Control | GB | 40% | 95% | 96% | 70% | – | ||||
| Fipronil – Termidor 80 WG (study established 1994 and closed 2010) | ||||||||||
| Only five treated GB plots were attacked during the life of the study, but due to the low attacks at untreated control plots and multiple products in the test site, it was impossible to evaluate treatment effects. For additional information refer to the 2006 Termiticide Report (PMP, February 2007, page 66). | ||||||||||
| Control | CS | 14% | 18% | 2% | 3% | – | ||||
| Control | GB | 9% | 8% | 16% | 11% | – | ||||
| Fipronil – Termidor SC (study established 1999 and closed 2011) | ||||||||||
| 0.06†† | CS | 12 | 12 | 11.5 | 11.5 | 8 | 12 | 8 | 8 | 11.5+ |
| 0.125†† | CS | 12 | 12 | 11.5 | 11.5 | 8 | 12 | 12 | 12 | 11.5+ |
| 0.25 | CS | 12 | 12 | 11.5 | 11.5 | 12 | 12 | 12 | 12 | 11.5+ |
| 0.06†† | GB | 10 | 12 | 9.5 | 11.5 | 9 | 10 | 5 | 11 | 10.5+ |
| 0.125†† | GB | 12 | 12 | 11.5 | 11.5 | 8 | 11 | 10 | 10 | 11.5+ |
| 0.25 | GB | 0 | 9 | 2.5 | 11.5 | 2 | 2 | 12 | 12 | 11.5+ |
| Control | CS | 1% | 67% | 85% | 50% | – | ||||
| Control | GB | 50% | 97% | 86% | 88% | – | ||||
| Chlorfenapyr – Phantom (study established 1996 and closed 2011) | ||||||||||
| 0.125†† | CS | 15 | 15 | 1 | 7 | 1 | 1 | 6 | 7 | 1 |
| 0.25†† | CS | 15 | 15 | 11 | 11 | 2 | 5 | 5 | 15 | 6 |
| 0.5 | CS | 15 | 15 | 15 | 15 | 4 | 4 | 15 | 15 | 15 |
| 0.75 | CS | 15 | 15 | 1 | 1 | 5 | 5 | 15 | 15 | 15 |
| 1 | CS | 15 | 15 | 15 | 15 | 5 | 7 | 8 | 8 | 7 |
| 2 | CS | 15 | 15 | 15 | 15 | 1 | 9 | 15 | 15 | 15 |
| 0.25†† | GB | 9 | 11 | 0 | 0 | 2 | 6 | 5 | 8 | 6 |
| 0.5 | GB | 5 | 10 | 1 | 8 | 4 | 4 | 12 | 15 | 5 |
| 0.75 | GB | 15 | 15 | 4 | 7 | 5 | 12 | 11 | 15 | 8 |
| 1 | GB | 8 | 15 | 9 | 11 | 5 | 11 | 11 | 11 | 11 |
| 2 | GB | 6 | 11 | 15 | 15 | 12 | 12 | 8 | 14 | 12 |
| Control | CS | 19% | 66% | 79% | 44% | – | ||||
| Control | GB | 54% | 87% | 99% | 95% | – | ||||
| Chlorantraniliprole – Altriset (study established 2004 and closed 2015) | ||||||||||
| 0.025 | CS | 3 | 5 | 1 | 7 | 2 | 5 | 11 | 11 | 7 |
| 0.05†† | CS | 5 | 6 | 3 | 11 | 9 | 11 | 4 | 4 | 11 |
| 0.1 | CS | 2 | 11 | 11 | 11 | 11 | 11 | 11 | 11 | 11 |
| 0.25 | CS | 4 | 11 | 11 | 11 | 11 | 11 | 11 | 11 | 11 |
| 0.025 | GB | 2 | 5 | 0 | 1 | 1 | 2 | 1 | 2 | 1 |
| 0.05†† | GB | 2 | 2 | 0 | 2 | 2 | 4 | 1 | 2 | 2 |
| 0.1 | GB | 4 | 7 | 1 | 6 | 4 | 6 | 2 | 4 | 4 |
| 0.25 | GB | 2 | 4 | 2 | 9 | 2 | 8 | 4 | 8 | 8 |
| Control | CS | 5% | 63% | 88% | 49% | – | ||||
| Control | GB | 13% | 82% | 88% | 89% | – | ||||
| † EPA: years with no penetration through treated soil in any plot. | ||||||||||
| FL: years with no annual damage more severe than ASTM 9 to blocks or boards on 90% or more of the plots per site (each annual evaluation stands alone, not cumulative). | ||||||||||
| FL SE States: years with no annual damage more severe than ASTM 9 to blocks or boards on 90% or more of the plots across the southeastern sites (damage ratings are annual, not cumulative). | ||||||||||
| †† Registered label rates. | ||||||||||
Test methods
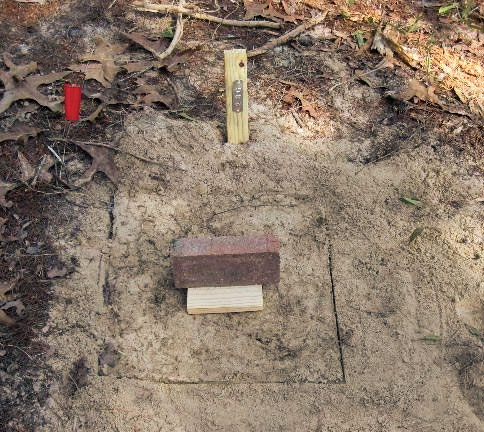
Figure 2. A freshly completed ground board plot.
Photo: USFS
Evaluations of soil-applied termiticides are specified by the EPA in its Product Performance Test Guideline – OPPTS 810.3600. There are currently two accepted protocols for testing these products: the ground board test and the modified ground board (or concrete slab) test. Ten replicates of each concentration, including water-only controls, are installed for each candidate termiticide in each of the four national field sites.
For the ground board test, a 17-sq.-in. area is cleared of debris, roots and rocks and treated with the candidate termiticide. After drying, a 6-sq.-in. pine board is centered on the exposed, termiticide-treated soil, and held in place with a brick (see Fig. 2).
The concrete slab test is very similar. In this test, the treated plot area is also 17-sq.-in. and cleared as described above. After treatment, the soil is covered by a polyethylene vapor barrier, and a 21-sq.-in. concrete slab is poured around a 4-in.-diameter PVC pipe placed at the center (see Fig. 3).
Once the concrete has set, the vapor barrier is cut out and removed from the bottom of the pipe, and a 3.5×2.5×1.5-in. rectangular pine block is placed on the treated soil at the bottom of the pipe. To prevent weathering of the treated soil, a PVC cap is placed on the pipe (see Fig. 4).
For both methods, solutions of candidate termiticides are applied to the soil at the pre-construction volume of 1 gal. per 10 sq. ft. in both test types. For each plot, the wood is evaluated for termite damage annually using the Gulfport scale, and the presence or absence of live termites infesting test blocks or boards is also noted.
Damage data are collected using the Gulfport scale: 0 = no damage, 1 = nibbles-to-surface etching; 2 = light damage with penetration; 3 = moderate damage; 4 = heavy damage; and 5 = board or block destroyed.
Performance standards
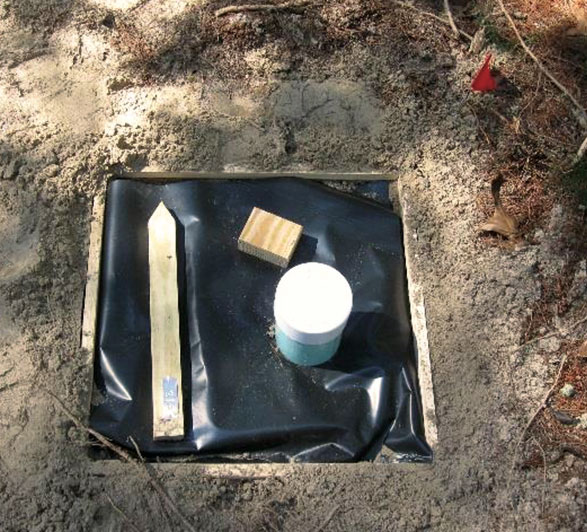
Figure 3. A freshly treated concrete slab plot, prior to concrete pouring.
Photo: USFS
Some states have even developed their own standards for acceptance of termiticides based on product performance. For example, Florida developed a standard in 2003 called the Florida Termiticide Efficacy Rule (5e-2.0311, FAC), which is used by its state regulators to accept or reject products that have obtained federal registration.
Under the EPA Guideline, a candidate termiticide should prevent termites from penetrating treated soil in all (100 percent) test plots for at least five years at the lowest label rate that will be registered using the concrete slab test method. For this reason, the data in the EPA sections of Tables 1 and 2 is reported in years of 100 percent control.
Success for a candidate termiticide under the Florida Rule is defined differently than success under the federal guideline. Only data from southeastern states are considered by the Florida Rule. To pass this rule, a candidate termiticide must prevent damage more severe than ASTM 9 (equivalent to a Gulfport rating of 1) to greater than 90 percent of all test blocks for at least five years in one or more of the southeastern sites using the concrete slab method. A minimum of 10 plots is required. All test plots are evaluated annually, and the rule is applied for each year independently (previous infestations of plots are not considered).
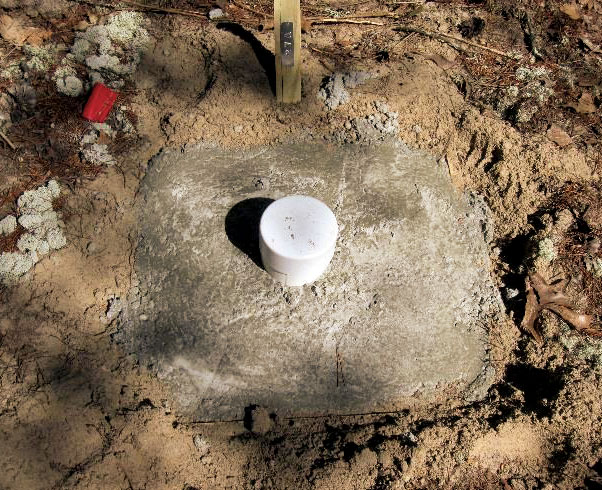
Figure 4. A freshly completed concrete slab plot.
Photo: USFS
Latest test results
Tables 1 and 2 provide repellent and nonrepellent termiticide evaluation results collected through 2014. Similar to last year (PMP, March 2015), Altriset (SC formulation containing 18.4 percent chlorantraniliprole) is the only product for which new data can be reported. In the 2015 data set for both ground board and concrete slab methods, all locations and concentrations remained the same as the previous report (PMP, March 2015). The Altriset study was closed in 2015 at the request of its manufacturer, Syngenta Crop Protection.
While it’s a tough standard for product performance, the EPA’s Guideline is a valuable tool for determining termiticide efficacy. However, in regulation there is a difference between rules and guidelines: Rules must be followed by regulators, whereas guidelines are not required to be strictly followed.
The EPA’s primary mission is to protect human health and the environment. In following that mission, federal termiticide registration is based on more than just efficacy. The product’s toxicological and environmental impacts are also considered by the agency. The EPA may register products that do not strictly adhere to its efficacy guideline. State regulators, on the other hand, tend to be more concerned with efficacy, since the relative safety of the product has been considered prior to federal registration. Because it is a rule, compliance with the Florida Rule is mandatory for termiticide regulators in Florida.
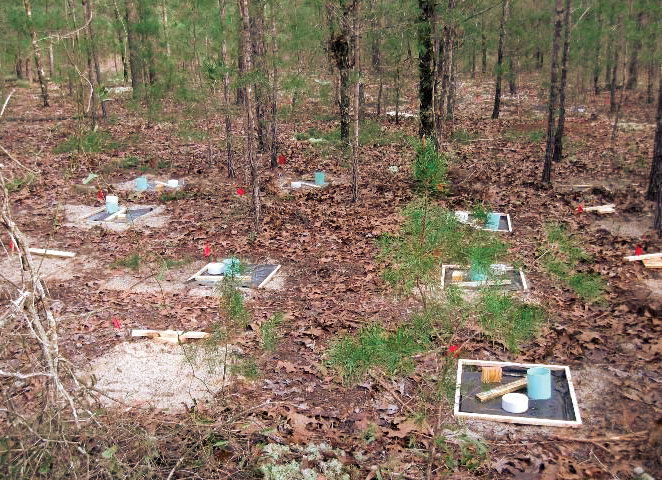
Figure 5. Freshly treated ground board and concrete slab plots, prior to concrete pouring.
Photo: USFS
Conclusions
For years, the USFS Termiticide Testing Program has served the public and pest management industry, providing unbiased efficacy data for state and federal regulators. The testing program has provided performance data for all termiticides currently registered in the United States. By providing these reports, the efficacy data of registered termiticides is made available to the industry, pesticide manufacturers, regulators and the American public.
Pest management companies can use the data to determine the best products to offer their customers, and the public to make informed decisions about the protection of their homes, possibly their largest investment. Annually, we will continue to provide updated information about these products.
Research Entomologist Dr. Thomas Shelton is the team leader; Donald Fye is a biologist, Dr. Mark Mankowski is a research entomologist, and Dr. Juliet Tang is a research forest products technologist. All are with the USDA-FS Forest and Urban Insect Ecology Research Team, Starkville, Miss.

Project leader retires
On Dec. 31, 2015, Carol Clausen, the project leader for the Durability and Wood Protection unit at the U.S. Department of Agriculture’s Forest Service Forest Products Laboratory in Madison, Wis., retired after 31 years of service to the federal government. Clausen worked with cooperators worldwide on a wide variety of projects concerning the protection of wood-in-service from fungal decay and insect feeding. Her leadership over the process of moving our termite team to the Forest Products Laboratory (FPL) was greatly appreciated. As the Forest Service searches for someone to fill her position, the termite team is currently reporting to Assistant Director Dr. Michael Ritter at FPL in Madison. —Dr. Thomas Shelton
Leave A Comment