Click to enlarge. (CHART: PMP STAFF)
Imagine trying to manage a baseball team in a world without scoreboards, game recaps, or statistics to help track trends, individual and team performances, and competitors.
Thankfully, today’s sports and business worlds have access to an arsenal of data that — if accurately obtained, smartly sifted through, and correctly leveraged — can help owners and managers win every day.
Information is power. By measuring the key performance indicators of one’s pest control company against successful players in the industry, owners and managers can identify their financial and operational strengths and weaknesses, as well as areas ripe for efficiency improvements such as revenue growth, productivity gains, cost control and more.
The benchmarking intel in this 2019 Pest Control Operating Cost Study is designed to serve as an industry fitness tracker for team owners and managers. Pest Management Professional (PMP) and PCO Bookkeepers teamed up to share the data so pest control company owners and managers can better keep score and coach their organizations to record growth and profit.
STUDY PARTICIPANTS
PCO Bookkeepers’ clients collectively generate more than $600 million in annual pest control revenue, helping ensure the accuracy of this study as a benchmarking barometer.
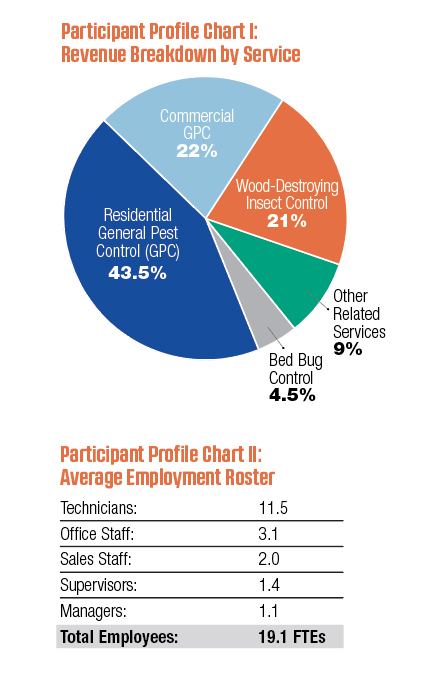
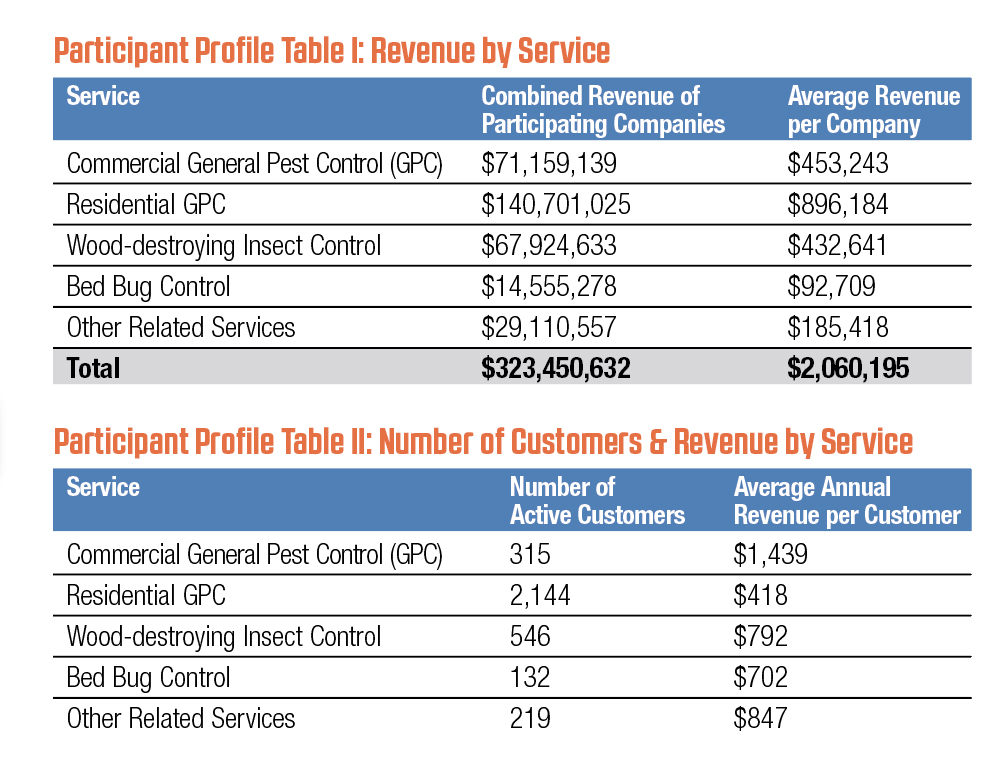
The subject companies of this 2019 Pest Control Operating Cost Study are clients of PCO Bookkeepers, each with annual revenue between $500,000 and $22 million. This study contains data from 157 firms reporting in 32 states. Participants’ combined annual revenue totals $323.45 million.
For more information on the study’s subject companies, please reference the accompanying Participant Profile tables and charts.
Click to enlarge. (CHART: PMP STAFF)
MINI SCOREBOARDS
Benchmarking financial and operational performances via this study can help owners identify “selling points” when seeking lenders, investors or buyers. It also can help owners and managers evaluate and improve their organizations’ performances and bottom lines.
Helping guide pest management professionals (PMPs) to those ends are mini scoreboards called financial ratios. These financial ratios are key to evaluating business performance, and to identifying potential trouble areas that could result in reduced profits or even business failure.
Click to enlarge. (CHART: PMP STAFF)
Just a few of the many important financial ratios include:
- Cash flow: Is it getting too tight?
- Accounts receivable: Is it taking too long to collect monies owed?
- Debt levels: Is additional debt being incurred, and if so, why and at what cost?
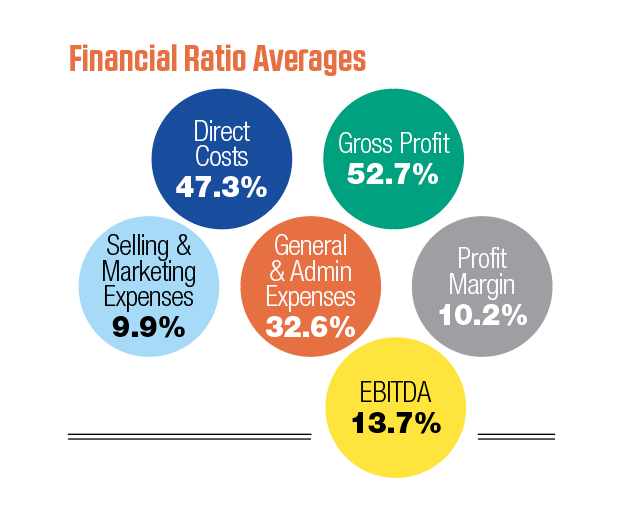
Ratio analysis helps PMPs quickly analyze an organization’s financial performance, primarily by measuring profitability and activity across key performance indicators.
Why keep score via financial ratios? People tend to improve what is measured. Call it business acumen, or call it competition (vs. one’s past performances, and the past and current performances of competitors).
How does your organization’s fiscal fitness compare to the industry averages in our Financial Ratio Averages chart?
PROJECTING PROFITABILITY
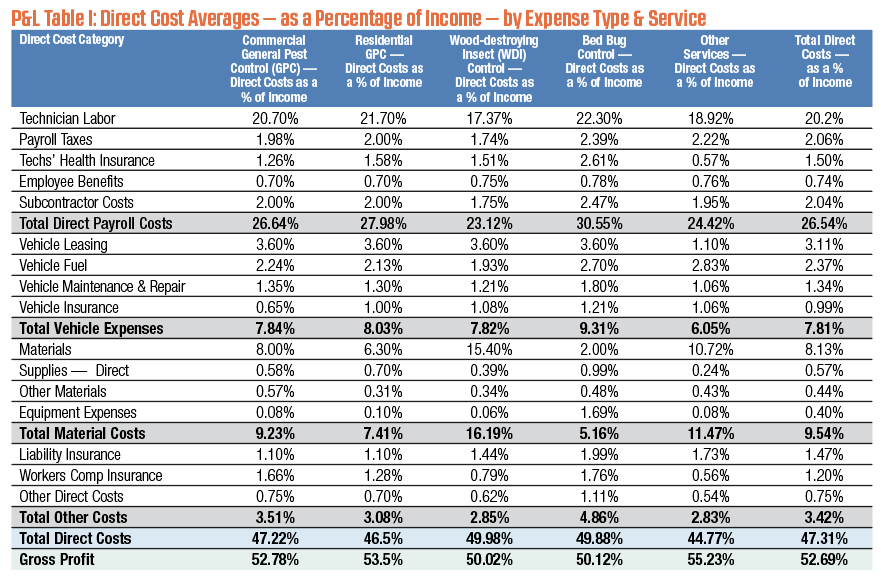
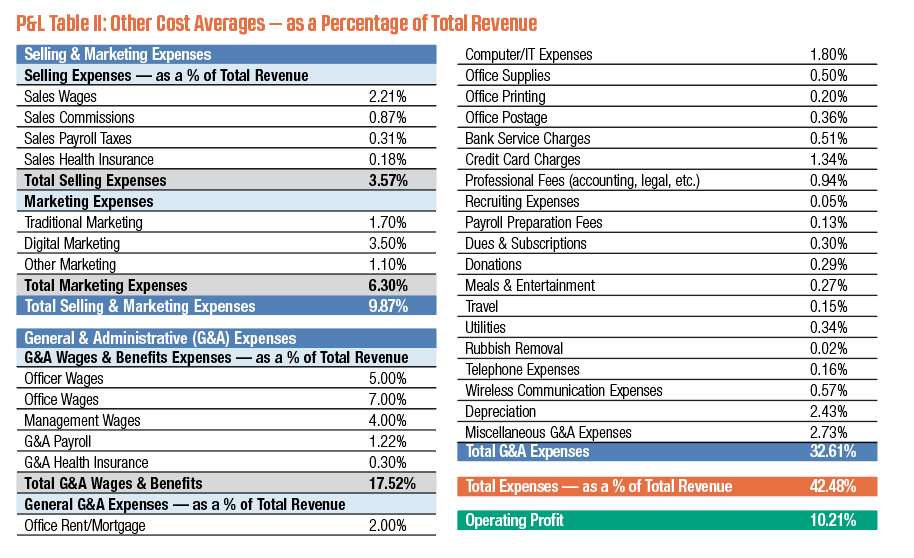
The income statement is one of the major financial statements used by accountants, financial institutions and business owners to determine entity profitability. Sometimes it is referred to as the profit and loss (P&L) statement, statement of operations, or statement of income.
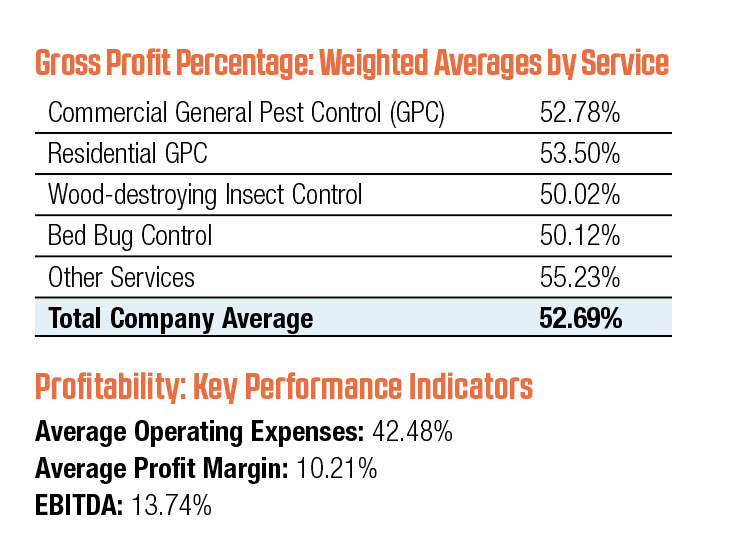
The income statement shows the profitability of a company during a specified time interval. It breaks down revenues and costs in key financial and operational areas. The P&L tables below provide snapshots of average costs for this study’s participants.
Profitability ratios reflect the overall effect of a company’s managerial efficiency. They also indicate a firm’s breakeven point, and the amount of money made once breakeven is achieved given a certain level of sales.
The ratios reflect the results of decisions management has made to maximize profitability. They are a class of financial metrics used to assess an organization’s ability to generate earnings, as compared to its expenses and other relevant costs incurred during a specific period of time.
Key profitability ratio terms include, among others:
- Gross profit percentage: How efficient a firm is at providing services before paying sales, marketing and fixed costs. Gross profit percentage is the single most important financial ratio, in this author’s opinion.
- Operating expense percentage: If this exceeds the gross margin, the business operates at a loss. If fixed costs are truly fixed, operating expense percentage will fall as a company grows.
- Profit margin: Net income — what owners work for.
- Earnings before interest, taxes, depreciation and amortization (EBITDA): Cash flow.
Click to enlarge. (CHART: PMP STAFF)
RESOURCE MANAGEMENT
Activity ratios indicate how efficiently a company uses and manages its resources (assets), including cash, accounts receivable, salaries, inventory, property and equipment. Higher activity ratios often indicate efficient use of those assets, whereas lower activity ratios can signal the inefficient use of assets.
For example, all other factors being equal, a company that keeps a modest amount of inventory usually is in better shape than a firm that must keep a large quantity of inventory. This is because of the costs incurred with inventory storage, management, insurance, and so on.
Some activity ratios are operational, as opposed to financial. Take, for example, revenue per employee:
The more revenue one produces per employee, the more efficiently the organization is using its people resources.
The People Resources bar charts at right detail pest control companies’ revenue and profit per employee by job classification. Because pest control companies typically employ far more technicians than managers, the revenue and profit per manager is much higher than the revenue and profit per tech. This doesn’t mean managers are more profitable than techs, or that owners should fire techs and hire managers. Rather, it serves as a tool to benchmark whether a company might be overstaffed, understaffed or right-staffed for each job classification.
Click to enlarge. (CHART: PMP STAFF)
DATA DRIVEN GROWTH
It’s not pure chance that data-driven business decisions tend to brighten a company’s top and bottom lines, and all P&L lines in-between.
Pest control company owners and managers should undergo regular fiscal fitness checks — closely studying their organizations’ financial performance, as well as that of industry colleagues.
Put simply, keeping score helps PMPs score more.
Click to enlarge. (CHART: PMP STAFF)
Get the full report: For a copy of the accounting consultancy’s 40-page 2019 Pest Control Operating Cost Study, please text “CFO” to 38470.
(ILLUSTRATIONS: iStock.com/SergeiKorolko, appleuzr, alexandragl1, bubaone, -victor-, Stevy, jjaakk)
You can reach GORDON, a managing member of PCO Bookkeepers and PCO M&A Specialists, at dan@pcobookkeepers.com.
Now I’m thinking of starting a Pest control company!