Sure, the marquee pests get all the attention. But certain other pests are growing in number — and importance.
 We discovered something unusual this year while crunching numbers for the 2016 Pest Management Professional (PMP) State of the Industry report. In response to the question “By approximately what percent do you expect your gross revenue to change from 2014 to 2015 for the following pests,” none of the Top 5 (weighted average) pests were our typical Top 5: ants, bed bugs, cockroaches, rodents and termites. Instead, stored product pests ranked No. 1, followed by birds, invasive species, wildlife and flies.
When we asked the same question, looking ahead for 2015 to 2016, we got the same Top 5, with flies and wildlife swapping the No. 4 and No. 5 spots in the rankings.
Are they the most profitable? Not when compared to the Top 3, termites, bed bugs and ants. But with an overall rosy outlook to industry business prospects in 2016, we thought they were worth a second look because they just might continue to grow.
1. Stored product pests
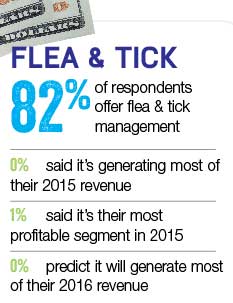
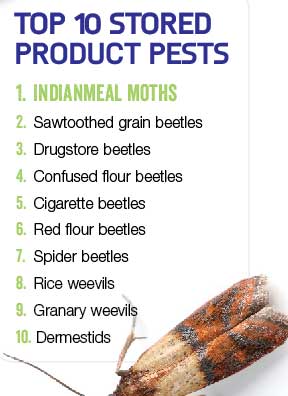 This year’s survey finds that 60 percent of respondents offer stored product pest management. While only 1 percent report that it’s generating most of their 2015 revenue, is their most profitable segment, and will generate most of their 2016 revenue — obviously, answers from pest management professionals (PMPs) who concentrate on industrial accounts — it caught our eye because it ranks No. 1 in revenue growth in 2015 and in predicted 2016 revenue growth.
Of course, that’s a weighted average: 61 percent actually report flat revenue on this pest segment from 2014 to 2015. Yet a full quarter of respondents say they saw a 1 percent to 9 percent increase; 3 percent saw a 10 percent to 24 percent increase, and 4.5 percent reported stored product pest accounts were up more than 25 percent in revenue. Only about 6 percent reported any kind of decrease, and that was split 3 percent less than 10 percent decrease and 3 percent more than 25 percent decrease (no respondents reported a 10 percent to 25 percent decrease).
For 2015 into 2016, the numbers also took them to the top spot of revenue growth, with some variations:
- 64 percent predict no growth (flat),
- 29 percent predict growth between 1 percent and 9 percent,
- No one predicted growth of 10 percent and 24 percent, but…
- 4.5 percent predict growth of more than 25 percent.
Expected decreases are again at a minimum for stored product pests, with just 1.5 percent forecasting a decrease of 10 percent and 24 percent, and another 1.5 percent forecasting a decrease of more than 25 percent.
2. Birds
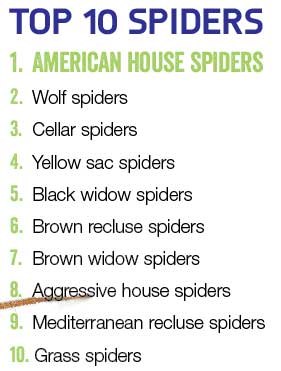
 The Top 3 birds this year by prevalence are no surprise: Pigeons, starlings and house sparrows are the three species with the least restrictions for control methods.
Still, with 51 percent of respondents offering bird management, it’s worth noting that crow, grackle and goose populations weren’t far behind in numbers. Seagulls, barn swallows and turkey vultures round out the bird species options for respondents, with a “miscellaneous” category coming in last place.
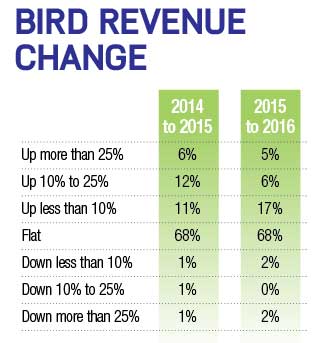
With their weighted average, birds come in second place of all pest segments for the greatest revenue change, both for 2014 to 2015, and 2015 to 2016. Breaking that down further, 68 percent report flat revenue for both time periods. Yet 6 percent report accounts were up more than 25 percent in revenue for 2015, and 5 percent predict that percentage in 2016.
Eleven percent say they saw a 1 percent to 9 percent increase in 2015 (and another 17 percent cite that for 2016), while 12 percent saw a 10 percent to 24 percent increase for 2015. For 2016, that number is halved — just 6 percent. Still, the reported and forecasted decreases for these time periods are downright negligible: 1 percent to 2 percent in each range.
3. Invasive species
 Ranked No. 3 in growth for 2014 to 2015, and No. 4 in expected growth for 2015 to 2016, this segment is an intriguing one — primarily because we didn’t define the segment for respondents. Yet 51 percent report they offer invasive species management, and 3 percent say it’s generating most of their 2015 revenue, been their most profitable segment in 2015, and predict it will generate most of their 2016 revenue.
So what are invasive species? They’re the pests that are new to your area, even if they might be established elsewhere. They’re the exhilarating (and perhaps frustrating) accounts, where your tech comes back with a specimen and the entire team delves into the tech guides on the bookshelf, looking for identification “tells” and control recommendations.
Like the multicolored Asian lady beetle or the brown marmorated stink bug, over time these invasive species calls will become more routine. Part of the thrill (or dread, depending on whether you’re a glass half-full or half-empty type of person) is wondering what will become The Next Big Thing. Could it be the conehead termite (Nasutitermes corniger), a Caribbean native thought to be eradicated in Florida in 2003, but making random appearances in the Sunshine State? Is it Drosophila gentica, a Central American fruit fly that prefers flowers to fruit and is second-most prevalent only to the common fruit fly in Los Angeles? Keep an eye out for our regularly occurring Pest Trends feature, which compiles these new population influxes.
4. Wildlife
 Only 47 percent of respondents to this year’s survey offer wildlife management, yet:
- 5 percent said it’s generating most of their 2015 revenue,
- 7 percent said it’s their most profitable segment in 2015, and
- 6 percent predict it will generate most of their 2016 revenue.
These numbers are none too shabby for an often-overlooked segment when one considers wildlife came in fourth as an increased revenue change from 2014 to 2015, and fifth for 2015 to 2016.
Breaking that down further, 59 percent report flat revenue for 2014 to 2015, and 56 percent predict no change for 2015 to 2016. Nearly 4.5 percent report accounts were/will be up more than 25 percent in revenue for both time periods.
Nineteen percent say they saw a 1 percent to 9 percent increase in 2015 (and another 16 percent cite that for 2016), whereas 16 percent saw a 10 percent to 24 percent increase for 2015. For 2016, that number is 19 percent. Just 1 percent reports a decrease in revenue for 2014 to 2015, while 3 percent report a downturn for 2015 to 2016.
5. Flies
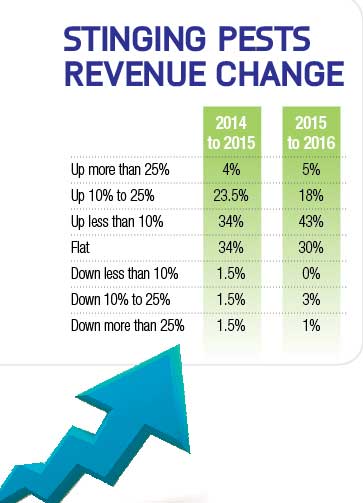
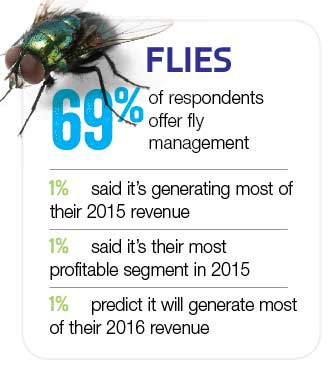 Rounding out the Top 5 of “ones to watch” from the 2014 to 2015 period, flies actually jump to No. 3 for 2015 to 2016. Approximately 69 percent of respondents offer fly management, but only 1 percent report it’s generating most of their 2015 revenue, it’s their most profitable segment in 2015, and that it will generate most of their 2016 revenue.
What makes their revenue so buoyant, however, is the rate of decrease year to year — less than 2 percent for 2014 to 2015, and just 3 percent predicted for 2015 to 2016. About 51 percent for 2014 to 2015 (and 46 percent for 2015 to 2016) say the revenue is flat, but the increased percentages are encouraging: Thirty-three percent report 1 percent to 9 percent growth for 2014 to 2015, and that number jumps to 40 percent for 2015 to 2016. Another 13 percent for 2015 (11 percent for 2016) say revenue is up 10 percent to 25 percent.
But let’s keep perspective. One percent say it’s up more than 25 percent over 2014 numbers, and no one forecasts such a leap for 2016.
But from the lead-taking house fly to the last-place blow fly, this group can consistently bring it when it comes to money-generating accounts.
So there you have it: The Top 5 revenue changers for 2015 to 2016. Does it jibe with what you’re finding in the field? If so, are you taking advantage of it with your sales, marketing and training efforts?
artwork: ©istock.com
Leave A Comment