Sources: PCO Specialists and William Blair estimates
The William Blair/PCO M&A Specialists Pest Index tracks the monthly performance of 159 different privately held pest control companies located across 31 states with combined 2021 revenue of more than $400 million. This report, which is published every month, can be used by pest management professionals (PMPs) to track the monthly performance of several different U.S. pest markets, including residential, commercial, termite and bed bug. The Pest Index is built upon several years’ worth of thousands of monthly data points that have been reconciled by PCO Bookkeepers.
Why should a PMP care about the Pest Index? The primary reason is to use it as a benchmarking tool. For example, if your business primarily consists of residential customers, then you can flip to the residential section to peruse Pest Index performance over the past several months. If your business is growing while the Pest Index is declining, that may be an indication that you are taking market share.
Although results vary by geography, there are enough companies and data points in the Pest Index to be considered “statistically significant” and generally reliable as a benchmark for the broader U.S. market. Given the lack of real-time market information available to PMPs in the U.S., we find more and more owners and managers are turning to the William Blair/PCO M&A Specialists Pest Index for help in gauging the performance of their businesses. What once started as a simple exercise to improve information flow for institutional investors has since expanded to support the decision-making processes for many small business owners — and even the large, publicly traded companies — across the country.
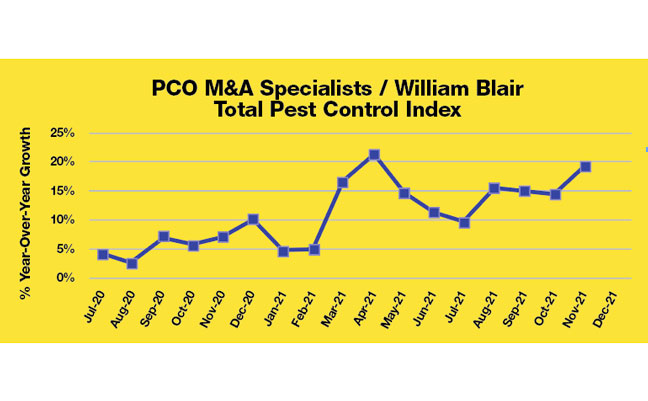
Looking at the Total Pest Control Index in 2020, we observed performance slow down materially beginning in April 2020, with residential pest and termite revenues decelerating to flattish year-over-year growth, as many customers opted to temporarily cancel services. Meanwhile, the commercial pest declined significantly on a year-over-year basis due to temporary customer closures. The residential index then rebounded strongly in June 2020, which was earlier than we expected due to pent-up demand from temporary cancelations from existing customers, and new customer contracts as people working from home became more aware of pest activity in and around the house. This was consistent with what we heard from the large public companies. For example, Rollins said that the summer of 2020 saw a “record-setting number of call-center sales days,” and mosquito sales were up more than 50 percent.

Notes:
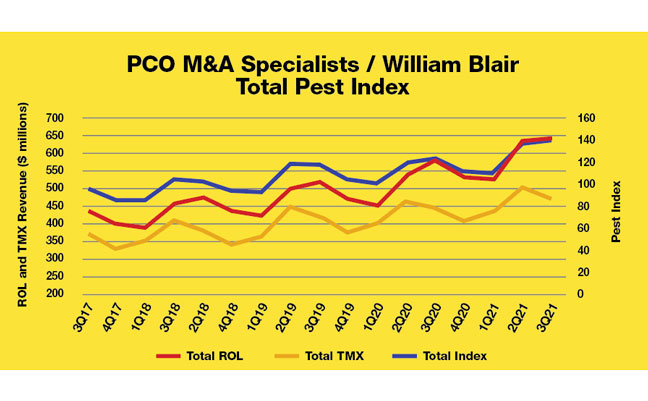
1) Total Pest Indexed to May 2017 = 100
2) ROL and TMX are organic revenue figures (total revenue less acquired revenue); TMX total pest index excludes Europe
Sources: PCO Specialists and William Blair estimates
The commercial index took a little longer to recover, rebounding in the fourth quarter of 2020 and then accelerating significantly in the early months of 2021. In fact, average commercial growth in the second quarter of 2021 was slightly above 20 percent. As many pest control company owners will attest, this is uncharacteristically high growth for a commercial pest business. It is true that this strong commercial growth observed throughout much of 2021 is partially due to easy comparisons with the lackluster performance observed in 2020. However, if we look at commercial pest growth on a two-year basis — 2019 to 2021 — the Pest Index shows high single-digit monthly growth rates, which is indicative of a healthy commercial pest market that has recovered well from the disastrous pandemic-related disruption of 2020.
Meanwhile, the residential and termite indices performed extremely well in 2021. We expected residential pest growth to slow down in the second half of 2021, given the difficult comparisons with the strong summer and fall performance in 2020. However, our predictions were incorrect. Since May 2021, the residential pest index is showing average growth of 16 percent year-over-year, and the termite index is showing average growth of 9 percent. It appears that many of the new customers gained in 2020 continue to greatly value their pest control providers, opting to retain services even after their annual contracts have expired. This fact, combined with the benefit of “word of mouth” from recently converted neighbors, appears to be driving strong growth in the residential index. Therefore, we believe the setup for 2022 remains attractive, and helps explain the rising penetration rate of residential customers nationwide.
As an equity research analyst, this index has become a popular report among our institutional client base, which consists of portfolio managers, mutual funds, hedge funds and private wealth managers. It is used as a tool to help gauge how publicly traded companies in the pest control industry are trending throughout a given quarter. The Pest Index is published monthly, whereas public companies report their earnings only once per quarter. The insights gained from the Pest Index can help investors position their portfolio ahead of these earnings reports.
The data points gleaned from the William Blair/PCO M&A Specialists Pest Index are viewed as reliable indicators because of the strong correlation metrics between the index itself and performance at the publicly traded companies. For example, the R-squared of the Total Pest Index is 89 percent for Terminix and 93 percent for Rollins. This level of accuracy is hard to find in our business, and even harder to find for the U.S. pest control industry, which has limited data on the subject. One important conclusion from our findings is that the U.S. pest control market is healthy and continues to grow at an impressive clip, despite all of the disruption we have experienced over the past two years. Our hope is PMPs also can use this Pest Index, much like our investor base does, as a powerful benchmarking tool for their businesses.
Leave A Comment